
Learn the 8 key numbers to know before buying insurance, including claim settlement and solvency ratios. Make informed decisions to choose a reliable insurer and avoid costly pitfalls. #key numbers to know before buying insurance, #insurance performance ratios, #claim settlement ratio, #incurred claim ratio, #solvency ratio insurance, #persistency ratio, #expense ratio insurance, #grievance ratio insurance, #combined ratio insurance, policy lapse ratio, #insurance buying guide

Introduction: Why the Key Numbers to Know Before Buying Insurance Matter
It might be difficult to decide whether to get a general purpose, health, or life insurance coverage. Many concentrate on coverage quantities or premiums, but these don’t accurately reflect an insurer’s dependability. To make a secure, informed decision, you need to understand the key numbers to know before buying insurance. You can steer clear of dangerous providers by using these insurance performance ratios and measures, which provide information about an insurer’s financial stability, ability to pay claims, and customer happiness.
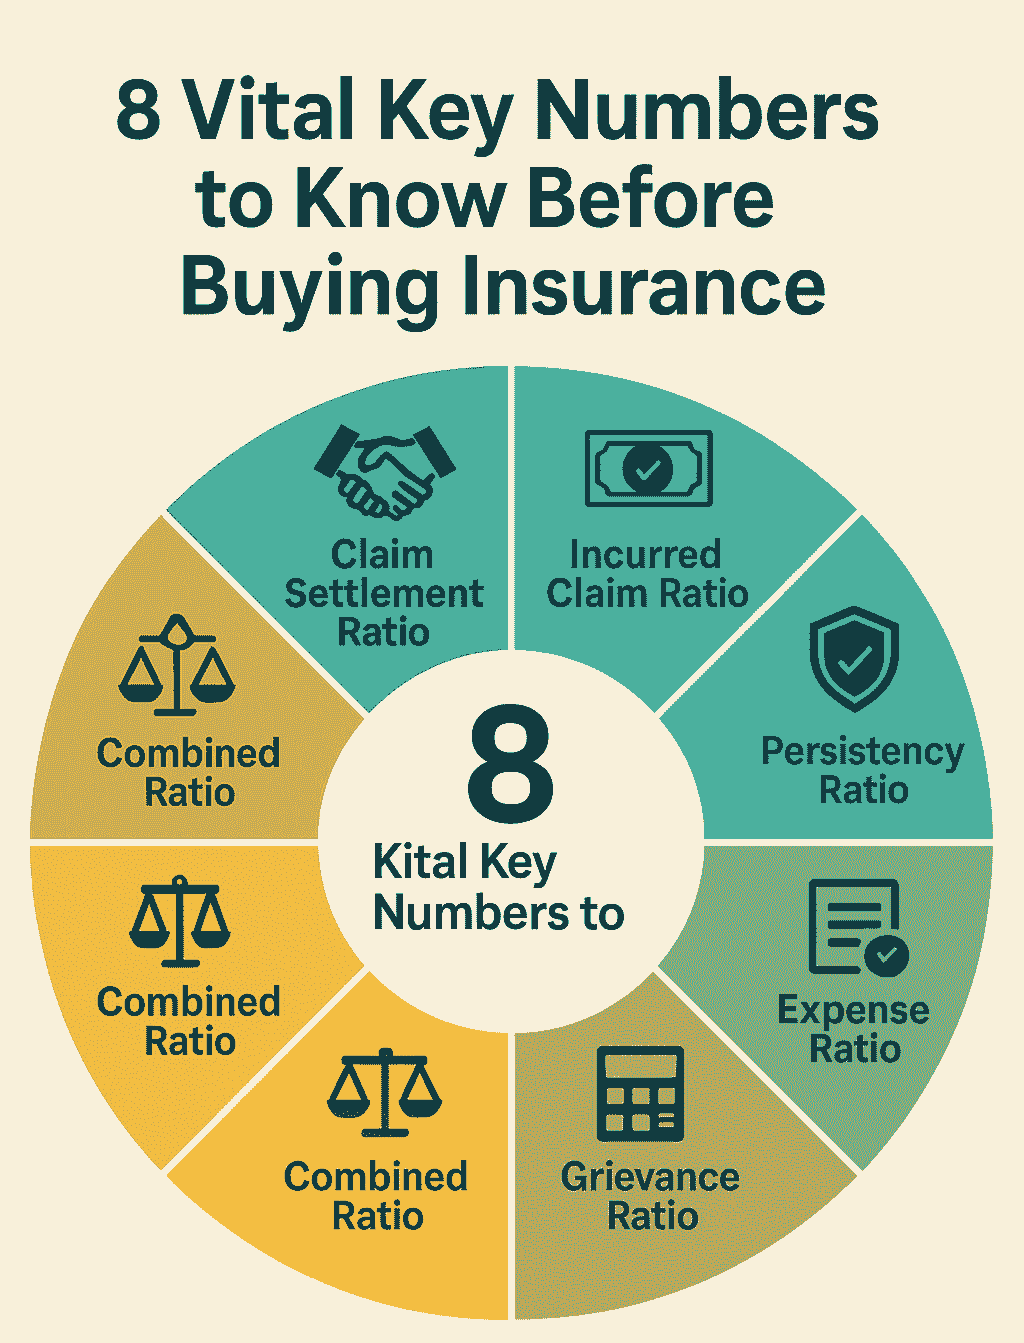
The six crucial ratios—claim settlement, incurred claim, solvency, persistency, expenditure, and grievance ratios—that have been emphasised by industry experts are covered in this handbook, along with two other metrics: the combined ratio and the policy lapse ratio. Together, these eight key numbers to know before buying insurance empower you to evaluate insurers thoroughly and steer clear of costly pitfalls.
Vital Key Numbers to Know Before Buying Insurance to Avoid Costly Pitfalls
Let’s examine how these Key Numbers to Know Before Buying Insurance indicators can safeguard your future financial well-being.
1. Claim Settlement Ratio: The Foundation of Trust
The claim settlement ratio (CSR) is one of the most essential key numbers to know before buying insurance. It displays the proportion of claims that have been resolved by an insurer over the course of a year. A CSR of 98%, for instance, indicates that 98 out of 100 claims were paid by the insurer. Reliability is indicated by a high CSR (above 95%), which guarantees that your claims will probably be honoured promptly and without denials.
For life or health insurance, where prompt payouts are crucial, a low CSR may be a sign of financial instability or a pattern of claim denials. Check this key number to know before buying insurance in annual reports from regulatory bodies like the Insurance Regulatory and Development Authority of India (IRDAI) or insurer websites.
- Example: An insurer with a steady 97% CSR over a number of years is a better option than one with a lower or erratic percentage.
- Pro Tip: To ensure long-term dependability, examine CSR trends over a period of three to five years.
2. Incurred Claim Ratio: Balancing Payouts and Stability
One essential statistic for general and health insurance is the incurred claim ratio (ICR). It compares the overall number of claims an insurance pays to the annual premiums received. The optimal ICR is between 70% and 90%, which shows that the insurer is still financially healthy despite paying claims. While a ratio below 50% can indicate numerous claim denials, which could negatively impact your experience, a ratio beyond 90% might indicate unsustainable losses.
For example, the ICR is 80%, which is a good balance, if an insurer receives $100,000 in premiums and pays $80,000 in claims. This key number to know before buying insurance helps you avoid insurers that might struggle financially or reject claims unfairly.
- Pro Tip: To choose a well-rounded provider, compare ICRs from insurers with comparable policies.
3. Solvency Ratio: The Financial Backbone
The solvency ratio evaluates an insurer’s capacity to fulfil long-term financial commitments, especially in times of crisis such as natural disasters or economic downturns. Stronger insurers keep levels above 2.0, however the IRDAI in India mandates a minimum solvency ratio of 1.5. Even during difficult times, a strong financial buffer to settle claims is guaranteed by a high solvency ratio.
This key number to know before buying insurance is crucial for long-term policies like life or health insurance, which may span decades. Low ratios run the danger of indicating financial weakness and resulting in claim denials. Check solvency ratios using insurer disclosures or IRDAI reports.
- Example: An insurer that just meets the 1.5 minimum is not as well-equipped as one with a 2.3 solvency ratio.
- Pro Tip: For extra assurance, pick insurers with a solvency ratio higher than 1.8.
4. Persistency Ratio: A Sign of Customer Satisfaction
The persistency ratio, which gauges policyholder happiness and trust, calculates the proportion of policyholders who renew their policies each year. A high persistency ratio (e.g., 80% or more) indicates that consumers are satisfied with the insurer’s offerings when measured at regular intervals, such as the thirteenth, twenty-fifth, or thirty-seventh month. A low ratio could be a sign of unstated expenses or subpar service.
For instance, 85% of policyholders renewed after their first year if the persistency ratio was 85% in the thirteenth month. This key number to know before buying insurance helps you gauge whether an insurer delivers on its promises, reducing future frustrations.
- Pro Tip: To get a more complete view of client loyalty, examine persistency ratios throughout a number of time periods.
5. Expense Ratio: Efficiency That Saves You Money
The amount of premiums received that goes towards operating expenses including agent commissions, marketing, and administrative costs is shown by the expense ratio. An efficient insurer is indicated by a smaller expenditure ratio (e.g., less than 25%), which frequently results in competitive premiums or superior benefits. A high ratio can indicate lower value for your money or higher premiums.
This key number to know before buying insurance helps you assess whether an insurer prioritizes customer value. Effective insurers transfer savings to customers in the form of improved coverage or lower rates. Look for expense ratios in industry analysis or yearly reports.
- Example: A 20% expense ratio insurer is more cost-effective than one with a 35% ratio.
- Pro Tip: For a fair assessment, compare cost ratios within the same insurance group.
6. Grievance Ratio: A Measure of Service Quality
The number of complaints per 10,000 policies sold is tracked by the grievance ratio, which offers information on customer satisfaction and service quality. While a greater ratio might suggest delays, misunderstandings, or unjust claim denials, a smaller ratio (for example, less than 10) suggests fewer complaints and higher service standards. This key number to know before buying insurance helps you avoid insurers with poor reputations.
- Example: A grievance ratio of 4, for instance, indicates that there are four complaints for every 10,000 policies, which is a high indication of consumer trust. Examine grievance statistics on consumer protection portals or in IRDAI’s yearly reports.
- Pro Tip: For a comprehensive perspective, combine complaints percentages with consumer reviews on websites such as Consumer Affairs.
7. Combined Ratio: A Snapshot of Profitability
To evaluate an insurer’s profitability, the combined ratio adds the cost ratio and the incurred claim ratio. A combined ratio below 100% denotes profitability, whereas a ratio above 100% indicates losses. The calculation is (claims paid + operating expenditures) ÷ premiums received. A 95% combined ratio, for instance, indicates that the insurer makes more money from premiums than it does from claims and expenses.
This key number to know before buying insurance is critical because a consistently high combined ratio may signal financial instability, potentially affecting claim pay-outs. For financial stability, look for insurers with a combined ratio under 100%.
- Pro Tip: To guarantee continued profitability, examine combined ratios over a number of years.
8. Policy Lapse Ratio: Gauging Policy Retention
The policy lapse ratio calculates the proportion of policies that policyholders do not renew or terminate early, frequently as a result of better options, financial difficulties, or discontent. Strong customer retention is indicated by a low lapse ratio (e.g., less than 10%), whereas a large ratio can point to subpar service or unaffordable rates. This key number to know before buying insurance complements the persistency ratio by highlighting why policies end.
- Example: A 5% lapse ratio, for instance, indicates that only 5% of insurance were not renewed, indicating client confidence. Look for information on lapse ratios in industry assessments or insurance reports.
- Pro Tip: A high persistency ratio combined with a low lapse ratio is a good sign of a trustworthy insurer.
Why These Key Numbers to Know Before Buying Insurance Trump Brochures
It’s like appraising a book by its cover if you merely pay attention to rates or coverage amounts. The key numbers to know before buying insurance—claim settlement, incurred claim, solvency, persistency, expenditure, grievance, combined, and policy lapse ratios—offer a more thorough examination of the performance, soundness, and customer service of an insurer. These indicators, which are supported by professionals in the field, assist you in avoiding insurers who have appealing marketing but subpar dependability. By prioritizing these key numbers to know before buying insurance, you can make data-driven decisions and protect your financial future.
Conclusion: Secure Your Future with the Key Numbers to Know Before Buying Insurance
Purchasing insurance is a long-term commitment, and the key numbers to know before buying insurance are your roadmap to choosing a trustworthy provider. The ability of an insurer to pay claims, preserve financial stability, and satisfy clients is demonstrated by the eight metrics discussed: claim settlement, incurred claim, solvency, persistency, expense, grievance, combined, and policy lapse ratios. By researching these key numbers to know before buying insurance, you can avoid risky providers and ensure your policy delivers when it matters most.
some time confirming these metrics using reliable platforms, insurer disclosures, or regulatory reports. A few hours of careful research can give you piece of mind and help you avoid expensive errors. Start exploring these key numbers to know before buying insurance today to make smarter, safer decisions.
FAQs: Key Numbers to Know Before Buying Insurance
Q1: Why are the key numbers to know before buying insurance so important?
By revealing an insurer’s dependability, financial stability, and customer happiness, these figures—such as claim settlement and solvency ratios—help you pick a reliable supplier.
Q2: What is a good ratio for settling claims?
A claim settlement ratio above 95% indicates a reliable insurer likely to honor claims, a critical key number to know before buying insurance.
Q3: What impact does my policy have on the solvency ratio?
Long-term insurance depend on an insurer’s ability to pay claims in times of crisis, which is ensured by a high solvency ratio (above 1.5, ideally 2.0 or more).
Q4: What is meant by a low grievance ratio?
A low grievance ratio (below 10 per 10,000 policies) signals fewer complaints and high service quality, a key number to know before buying insurance.
Q5: Why check the combined ratio?
Profitability is indicated by a combined ratio less than 100%, which guarantees the insurer’s stability and ability to pay claims.
Disclaimer: Key Numbers to Know Before Buying Insurance
This article related to key numbers to know before buying insurance is not intended to be financial or investment advice; rather, it is merely informational. Before buying an insurance policy, always get advice from a qualified financial counsellor or insurance specialist. To guarantee accuracy, confirm all insurance ratios using official sources such as insurer disclosures or IRDAI reports. The information offered may differ depending on the area or insurer and is based on broad industry knowledge.
Also Read: